
Every time you check the weather, track a package, or screen a call, you’re weighing uncertainty.
You're asking:
Will it rain today?
Will my order show up on time?
Should I answer this unknown number?
 Photo by Vitaly Gariev on Unsplash
That's probability!
It's how you make decisions when you can't be 100% certain about the outcome.
Questions like these don't have definite answers, but probability helps you think through them systematically.
What is Probability?
Probability is the language of uncertainty, and uncertainty is everywhere.
From weather forecasts, to logistics, to fraud alerts, we all face outcomes that aren't guaranteed. Probability measures how likely something is to happen before you know the result.
So, how can you make sense of it?
Start by putting uncertainty on a scale and assigning it a number.

0% (0) means impossible: the event cannot happen.
50% (0.5) means an even chance: the outcome is just as likely to happen as not.
100% (1) means guaranteed: the event will happen.
Quiz
Why do we assign numbers to uncertain outcomes?
How Probability Takes Shape
Values between 0 and 1 show how possible something is:
Closer to 0 means less likely.
Closer to 1 means more likely.
But not all uncertainty is the same.
Some outcomes are rare. Others are common.
To see the bigger picture, you'll need more than a number — you'll ned a visual representation that captures this.
In probability, that representation is a shape called the bell curve. The bell curve, or normal distribution, shows how outcomes are distributed.
Most outcomes land near the center, and fewer appear at the edges:

Think of the bell curve as a map of outcomes:
The center is where most values cluster with the mean, or average, at the peak of the curve.
The tails of the curve represent rare outcomes. These are the extremes — far from the center and less likely to occur.

Standard deviation measures how spread out the data is.
You can see this in the shape of the curve:
A narrow curve means the values are tightly clustered — low variation.
A wide curve means the values are more spread out— high variation.
The wider the curve, the greater the standard deviation.
Really, What Are the Chances?
Sometimes, more than one thing happens at the same time.
In probability, you'll want to pay attention to:
Interaction — how events relate to each other
Structure —whether events can happen together and what combinations are possible
Probability breaks down layered situations — whether events happen together, depend on each other, or compete for the same outcome.
To understand how events relate to each other when multiple things are in play, take a look at how they interact.
 Photo by Jakub Żerdzicki on Unsplash
Ask:
"Does one event change the outcome of another?" → That's interaction.
"Can both events happen at the same time?" → That's structure.
Together, they shape how to reason through scenarios, and which rules apply.
Two events can be independent but still unable to happen at the same time. Or they can be dependent and still both occur.
Some People Have All the Luck
Sometimes, two things happen — but not because they’re connected.
In probability, when one event doesn’t affect the other, those are called independent.
And when they both happen? It’s not fate. It’s math.
One doesn’t cause the other. One doesn't take away from the other.
For example:
If your friend is shopping for a rare jacket at a vintage store, does their shopping change your luck online for a limited release drop? Not at all.
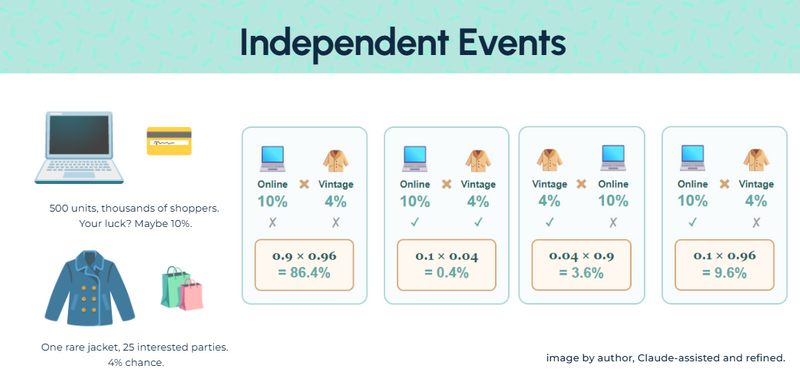
We're talking about different stores with different items and different crowds.
Your friend’s outcome doesn’t affect yours.
Two events. Two chances. No interference.
That’s independence.
Probability in Shared Spaces
In shared spaces, some events compete so that only one event can occur at a time.
In probability, events are defined by their outcomes. Sometimes, outcomes overlap. Probabilities may vary, but their decision space is divided.
When There Can Only Be One
There are cases where if one event happens, the other cannot. These are called mutually exclusive events.
All or nothing. No middle ground.
Consider a purchase attempt. The transaction either succeeds or fails. Either the transaction goes through, or it doesn't. You made a purchase, or you didn't.
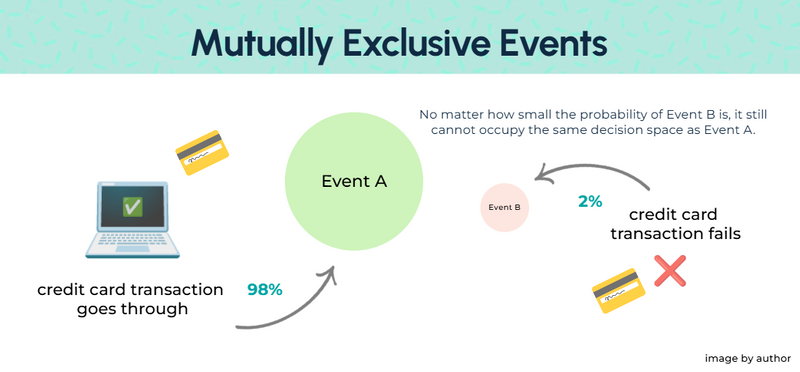
No matter how small the probability of a failure is, it cannot share the same space with success. This is not a numerical constraint. It's a structural one.
The two are not built to coexist together, because probability lives in structure first, numbers second.
In our example, these are the only two possible outcomes, and they do not overlap.
So their probabilities must sum to 1.
Since the probability that the credit card transaction goes through is 98% (0.98) and the probability that the transaction fails is 2% (0.02), they account for all possibilities.
0.98 + 0.02 = 1
When One...Or Maybe Both Can Be True
Some events don’t ask you to choose. They don’t fight for space. They just happen together. Events that can happen simultaneously are called inclusive events.

In this example, there is a clear overlap. In the case that both events happen, you need to account for the possibility that they're counted twice by subtracting the overlap.
Let’s say:
Probability of purchasing online = 60% (0.6)
Probability of purchasing in-store = 50% (0.5)
Probabilty of purchasing at both = 20% (0.2)
Then:
0.6 +0.5 -0.2 = 0.9
There is a 90% chance that at least one purchase happens.
Real Life Doesn't Always Fit the Mold
But not all uncertainty fits neatly into diagrams. Real life resists the mold.
It’s tempting to sort every outcome into neat categories. But not every outcome is a bell curve. Some are binary. Some are skewed. It gets messy.
Probability isn't just formulas — it’s knowing which structure fits and when it doesn’t. That’s where the real reasoning begins.
When One Event Triggers the Next
Some events don't just happen. They are redefined by another outcome, or condition.
For instance, new information can alter the likelihood of an event.
 For example:
When a friend texts you to meet somewhere, their actions affect yours. If you had no plans to be anywhere, the chance you were going out was basically 0.
After their text? There might be a 90% chance that you might be headed there.
That event didn't just inform yours. It directly influences it. This is dependence.
The second event is now conditional on the first.
The Math Behind the Maybe
Numbers don’t guarantee outcomes. They help you reason through them.
You use numbers and probability all the time — whether you name it or not.
 Photo by Vitaly Gariev on Unsplash
You're doing this when you:
Compare risks
→ Low chance of failure? Roll with it.
→ High chance of failure? Maybe not today.
Prioritize actions
→ High chance of sellout? Act early.
→ Low chance? Wait out the rush.
Decide under uncertainty
→ High chance your flight is delayed? Go ahead, download that movie.
→ Low chance? Head straight to your gate.
Take Action
You’ve learned how probability helps you think through uncertainty — from everyday choices to layered situations. And that you don’t need exact numbers to start thinking probabilistically.
Once you see probability in everyday decisions, you stop asking “What are the chances?” and start asking “What’s the smartest move?
 Photo by Sandra Seitamaa on Unsplash
Your feedback matters to us.
This Byte helped me better understand the topic.